
The Ecosystem

Autonomy.Hub

Open-source components for evaluating automated driving software on ROS 2. They supply the data your system under test sees and turn its output into metrics-based evidence for benchmarking automated driving deployments.

Module licensing
Apache-2.0
Interface
ROS 2
Hub & system packaging
Docker Compose & Helm
Data & infrastructure
Yours or ours, you decide
Dataflows

From configuration to evidence

Benchmark your module on annotated real-world data, or in simulation scenarios. Pick your case and follow the data step by step, from configuration to evidence.

Benchmark on annotated real-world data

Run your system on annotated real-world recordings and score its output against the annotations.

  1. You specify the deployment and hardware requirements of your system under test and describe the operational design domain (ODD) it is built for. The ODD shapes the test data.

  2. You select public datasets or your own recordings that cover the ODD and the situations you want to evaluate. Public datasets stay under their own licenses, your data stays yours.

  3. Autonomy.Datasets provides unified ROS 2 adapters and replays the selected recordings on request.

  4. The recorded drives are played back to your system as if it were on the road, and your system processes them.

  5. Autonomy.Evaluation compares the output of your system with the annotations of the data, using transparent and peer-reviewed metrics from the metric catalogue.

  6. The results become evidence: qualitative visual analysis in RViz, a traceable and reproducible report, and a leaderboard of the best modules per task.

Benchmark in simulation

Run your system through simulated scenarios, open or closed loop, and score it against the ground truth of the simulation.

Autonomy.Simulation is in development.

  1. You specify the deployment and hardware requirements of your system under test and describe the operational design domain (ODD) it is built for. The ODD shapes the test scenes.

  2. Scenarios come from the TC scenario catalogue, which also takes in scenarios from external databases such as scenario.center. External scenarios can also be used directly.

  3. Autonomy.Simulation turns the scenarios into simulated drives within the ODD you configured.

  4. Your system drives through the simulated scenes. In closed loop, its decisions feed back into the simulation, which reacts to them.

  5. Autonomy.Evaluation compares the output of your system with the ground truth of the simulation, using transparent and peer-reviewed metrics from the metric catalogue.

  6. The results become evidence: qualitative visual analysis in RViz, a traceable and reproducible report, and a leaderboard of the best modules per task.

Step 1 of 6
Results

What a run leaves behind

Every evaluation run can write the same JSON result structure, whether it evaluates replayed data or a simulation. The metrics inside reflect the selected evaluation.

Dataset replay

3D object detection

{
  "evaluation": "object_detection_3d",
  "version": "1.0.0",
  "description": "3D object detection",
  "complete": true,
  "num_samples": 3,
  "num_scenes": 1,
  "metrics": {
    "_value_": 0.641,
    "ap": { "_value_": 0.538 },
    "ate": { "_value_": 0.284 },
    "ase": { "_value_": 0.173 }
  },
  "scenes": {
    "scene-0103": {
      "num_samples": 3,
      "sample_ids": ["frame-001", "frame-002", "frame-003"],
      "metrics": {
        "_value_": 0.641,
        "ap": { "_value_": 0.538 }
      }
    }
  }
}
Simulation

Criticality metrics

{
  "evaluation": "criticality_metrics",
  "version": "1.0.0",
  "description": "Criticality metrics for simulated scenarios",
  "complete": true,
  "num_samples": 3,
  "num_scenes": 1,
  "metrics": {
    "_value_": 0.82,
    "ttc": { "minimum_s": 1.42 },
    "collisions": { "count": 0 }
  },
  "scenes": {
    "urban-crossing-07": {
      "num_samples": 3,
      "sample_ids": ["urban-001", "urban-002", "urban-003"],
      "metrics": {
        "_value_": 0.82,
        "ttc": { "minimum_s": 1.42 },
        "collisions": { "count": 0 }
      }
    }
  }
}
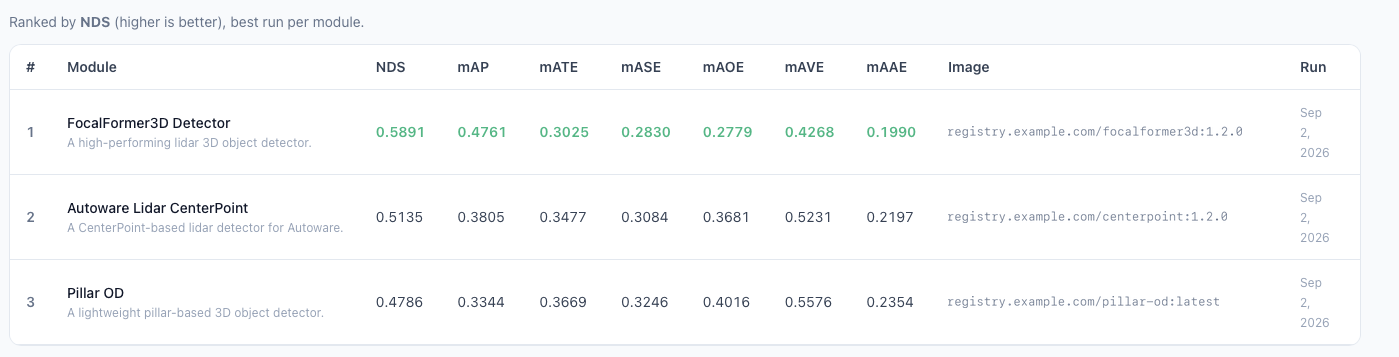
Leaderboard | Illustrative example: 3D object detection
Illustrative benchmark leaderboard ranking three lidar 3D object detection modules by NDS, with mAP, mATE, mASE, mAOE, mAVE and mAAE values and the container image used for each run.
Illustrative leaderboard, here for 3D object detection: the best modules per task, each row traceable to the container image it ran on.
Deployment

Runs where your data is

Every component and every system under test runs as a container image, so a run is reproducible: same input, same result, re-runnable on demand.

Docker Compose files for a single workstation, Helm charts for a Kubernetes cluster.

Run the evaluation on your infrastructure and only the results leave the building.
How we handle your data

Next Step

Evaluate your module on your data.

Request a scoping call

Tell us which module and which data you want to evaluate. We come back with a proposal for the setup, from a single evaluation run to a full benchmark.